
Understand your audience with analytics
Read your live listener stats and bandwidth usage, track listeners over time, and dig into geography, devices, peak times and retention with Advanced Analytics.
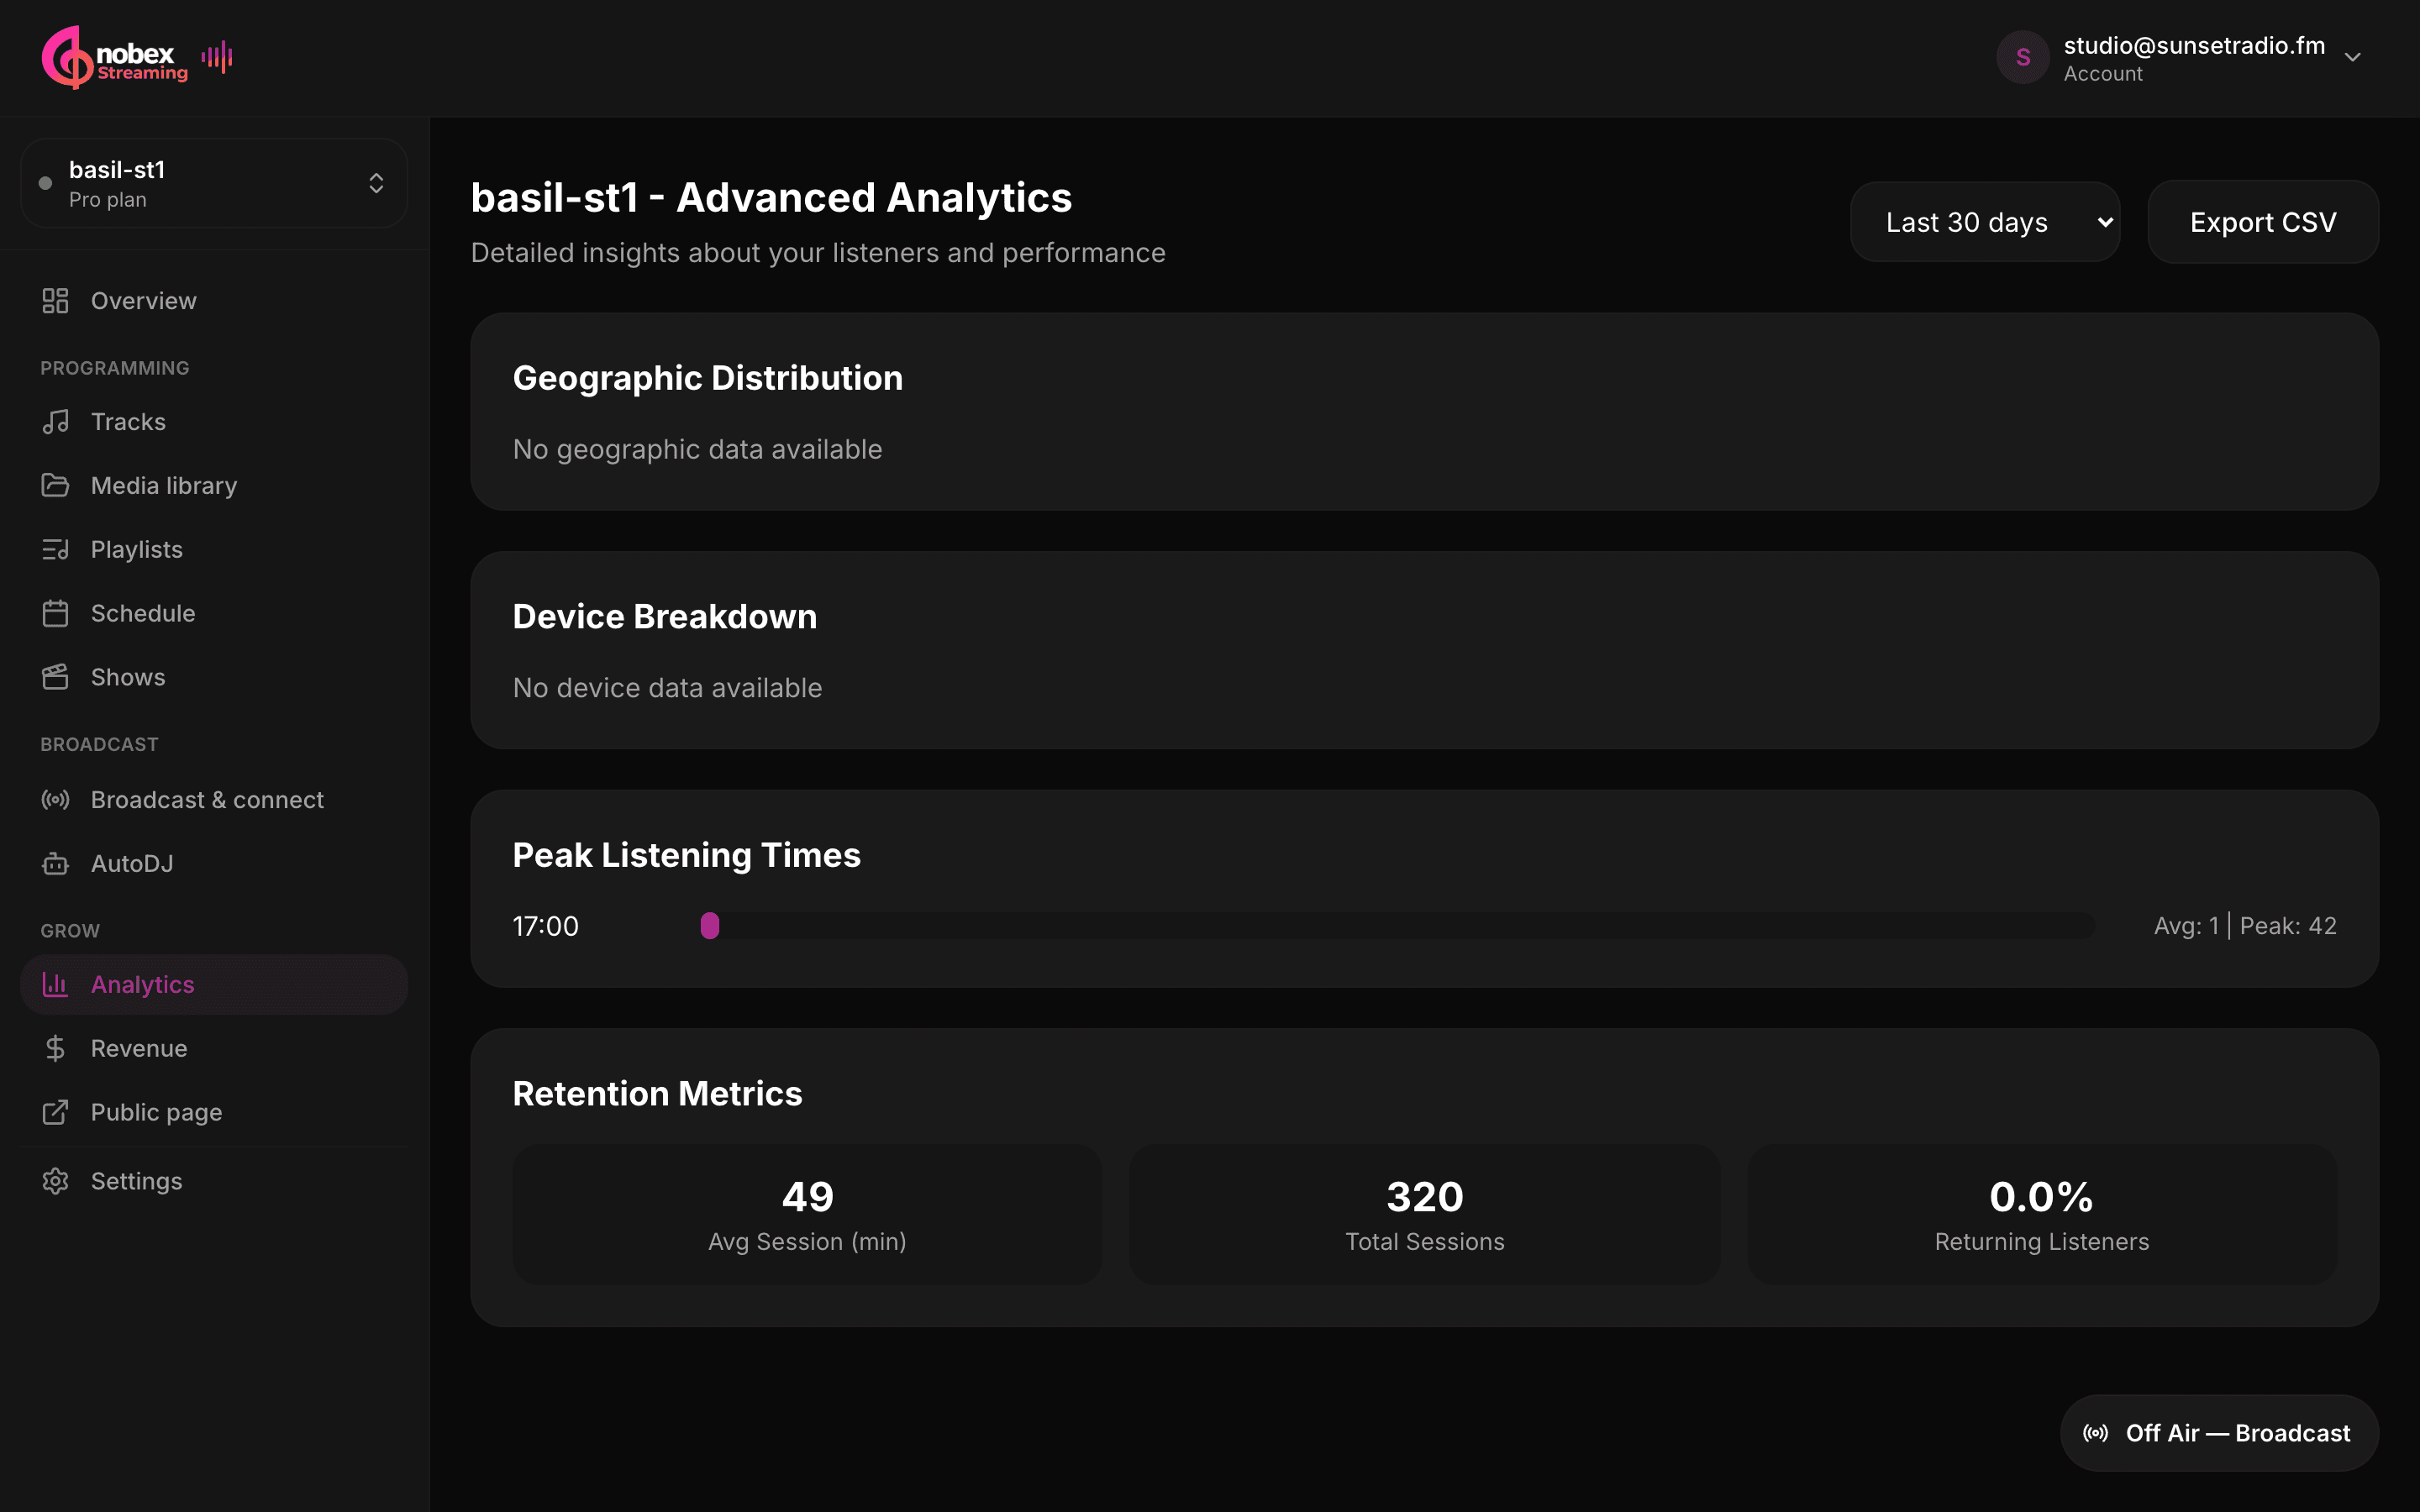
You can't grow what you can't see. Nobex gives you a live pulse on the station Overview, listener trends over time, and — on the Business plan — a deep Advanced Analytics view covering geography, devices, peak times and retention. Here's how to read all of it.
Live stats on the Overview
Open a station's Overview and the top cards refresh on their own every few seconds. At a glance you can see whether you're on air and how busy you are:
- Current Listeners vs your plan cap, with a color-coded bar — it turns yellow at 80% and red at 95% so you know when you're near capacity.
- Online / Offline status plus the current bitrate in kbps.
- Bandwidth Usage (This Month) — your month-to-date GB against your cap, with a projection and the same 80% / 95% warnings.
Watch the usage bars so caps never surprise you
Both the listener and bandwidth bars go yellow at 80% and red at 95%. Treat yellow as your cue to plan — upgrade a plan, add a stream, or set an overage cap — well before a red bar starts turning listeners away. Nobex also emails you at 80% and 95% automatically.
Listeners over time
Below the live cards, the listener history chart plots concurrent listeners across a window you choose — 1h, 24h, 7d or 30d — and calls out the peak and average for that range. Shorter ranges refresh more often, so the 1-hour view is close to real time.
This is where patterns show up: the nightly bump when your regulars tune in, the spike after you shared a link, the quiet stretch that might be a better slot for maintenance than for a live show.
Advanced Analytics (Business plan)
Open Analytics from the station menu for the deeper view. Advanced Analytics is a Business-plan feature — on lower plans the page shows what's included and a one-click upgrade. Once unlocked, you get four lenses on your audience:
- Geographic Distribution — a ranked breakdown of listeners by country, with each country's share.
- Device Breakdown — how many listeners are on desktop, mobile and tablet.
- Peak Listening Times — average and peak listeners by hour of day, so you can see exactly when your audience is around.
- Retention Metrics — average session length, total sessions, and the percentage of returning listeners.
A date-range selector (last 7 / 30 / 90 days, or a custom range) scopes every chart, and Export CSV downloads the underlying numbers for your own spreadsheets or reports.
On a lower plan?
Advanced Analytics unlocks with the Business plan. Compare what each tier includes in Plans and billing — the Analytics page can also upgrade you on the spot.
When the data starts flowing
Analytics is built from real listening activity, so a brand-new station starts empty. Data begins to accumulate once the station is active with an assigned node and real listeners connect — give it a few minutes after the first connections for the first snapshots to land. If a chart says there's no data yet, that's usually all it means.
Note
The Advanced Analytics page will tell you what it's waiting on — it shows your current station status and whether a node is assigned, so you can confirm everything's in place while data builds up.
Put the numbers to work
Schedule live shows for your peak hours
Let Peak Listening Times pick your slots. Going live when the most people are already tuned in maximises who hears it — and the retention numbers will tell you whether they stuck around.
Let geography shape your content
If a country you didn't expect keeps climbing the geographic list, lean into it — timezone-friendly show times, shout-outs, or programming that fits that audience can turn a surprise into a stronghold.
Where to go next
- See which analytics and limits each tier includes in Plans and billing.
- Grow the audience you're measuring with your public page, embeds and sharing.
- Turn that audience into revenue with tips, memberships and sponsors.
Keep reading
Ready to put this into practice?
Start a free trial and be on air in under five minutes — no software to install.
Start streaming free